
I had wound some wire on an FT-114-77 ferrite core and was looking at it's impedance. There was a resistive component and a capacitive component that looked so strange to me that I began to wonder if my measurements were correct. The purpose of this paper is to share with you some additional understanding of ferrites that I acquired from these measurements. I hope to show that:
The impedance of a wire passing through or wound around
a ferrite core can be inductive which is associated with
permeability,
resistive,
and even capacitive which is associated with self resonance.
All three of these parameters are
frequency dependent in
a ferrite.
The maximum attenuation of a ferrite core is not where the inductance is maximum, but instead is where the magnitude of the impedance is maximum. This impedance peak may even be where the impedance has no inductive component nor capacitive component i.e. at resonance.
The frequencies that you are trying to attenuate determine
the core that you should use.
Let me explain the basics of complex impedance a little so the following graphs will make sense to those of you who might be new to the field. Impedance is generally made up of two components, resistance and reactance. These two components are vector components i.e. they have a magnitude and a direction. We will define these vectors on an X-Y grid. Resistance will be a line going from zero to some value on the X-axis. The direction of resistance is always from zero to the right and the length of the line represents the value of the resistance. Reactance will be a line that is perpendicular to the resistance line i.e. it is a line that either goes from zero up if it is an inductive reactance or zero down if it is a capacitive reactance. Again the length of the line indicates the magnitude of the inductance. These lines fit our definition of a vector in that they have both magnitude and a direction. We will define the resistance as R and the reactance as X. Since the reactance is in a different direction from the resistance, we will place a J in front of the X to indicate this. Now we have an expression R+JX if there is a resistance in series with an inductive reactance or R-JX if the resistance is in series with a capacitive reactance. XC is used to designate a capacitive reactance and it is related to the value of the capacitor by XC=1/(2*PI*f*C) where PI = 3.14159... , f is the frequency in Hz, and C is the capacitance in Farads. XL is used to designate an inductive reactance and is related to the value of the inductor by XL=2*PI*f*L where PI=3.14159..., f is the frequency in Hz, and L is the inductance in Henries. This representation of impedance is shown graphically in Figure 1.

Since the resistance and reactance vectors form a 90 degree
right angle, the magnitude of the sum of the two, R+JX which we will call
Zmag , can be found by taking the square root of the sum of the squares
i.e. Zmag = SQRT(R^2 + X^2). Since Z is a vector and
Zmag is its magnitude, we need some way to specify which way it is pointing.
The convention for this is to measure the angle from the X-axis or in this
case the R-axis. If you remember any trigonometry at all, recall
that the angle that the vector R+JX makes with the horizontal
axis is given by the inverse tangent of X/R. Let us
assume that R = 3 ohms and XL= 4 ohms. Then Zmag = SQRT( 9+16) which
is 5. The angle, or phase angle theta, as it is typically called,
is the inverse tangent of 4/3=1.333 which is 53.13 degrees. We can
now say that the impedance is 5 at an angle of 53 degrees. Since
theta is positive, we know the reactive part of the impedance is inductive.
If X had been negative the magnitude would have remained the same, but
theta would have been the inverse tangent of -4/3=-1.333 which is
-53.13 degrees. We would now say that the impedance is 5 at an angle
of -53 degrees and we would immediately know that the reactive part of
the impedance is capacitive because of the negative phase angle.
If the impedance is purely reactive i.e. the resistive part of the impedance
is zero or very, very small, then the R vector will be zero or very, very
short. This results in a phase angle of 90 degrees if the reactance
is inductive or a phase angle of -90 degrees if the reactance is capacitive.
The following graphs were made using the AIM 4170 mentioned above. I first connected a 12 inch wire to the fixture forming a loop from the center pin of the connector to the common, and ran a scan from 0.1 MHz to 30 Mhz. I set the cursor at about 30 MHz, so the values listed to the right of the curve represent the values at this frequency. This is a busy curve, so bear with me as I point out some of the features. The color code on the curves is:
Black: Reactance
Tan: Resistance
Green: Zmagnitude
Purple: Phase angle (theta)
The horizontal axis is frequency and it runs from 0.1 MHz to about 30 MHz. Figure 2 is the plot from the 12 inch wire in the fixture.
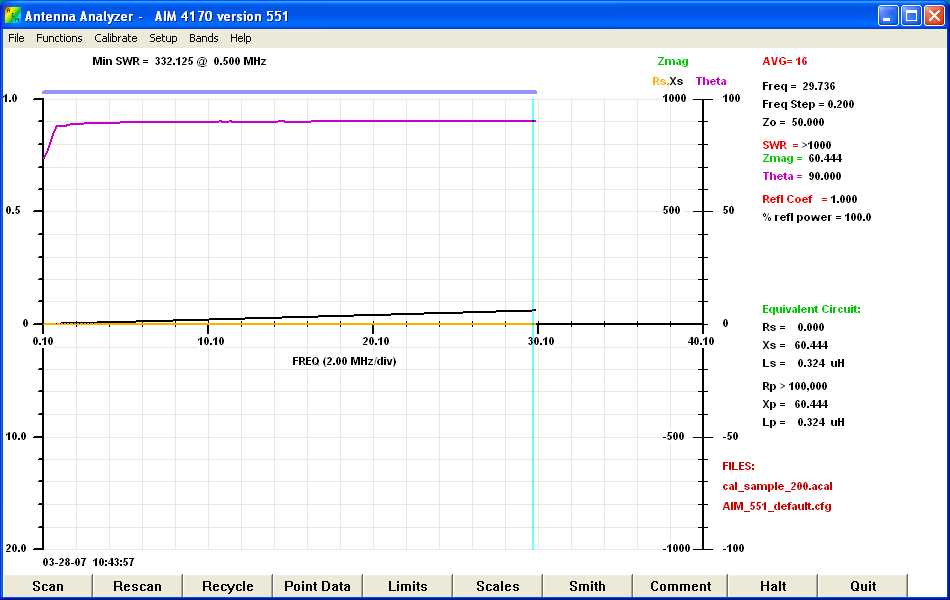
Figure 2: Single 12 Inch Wire. (click herefor a higher resolution graph)
Observe from the curves and the listings on the right
of Figure 2 that theta is 90 degrees and R=0
which indicates a pure inductance or R+JX is equal to J60.44 ohms at 29.736
MHz and the inductance is 0.324 uH. Since there is no resistive component,
Zmag = 60.44 ohms which is due entirely to the inductance. The curves
behave exactly like you would expect. The inductive reactance is
increasing linearly with frequency, there is no resistance, and theta stays
at 90 degrees. Zmag, which is in green, actually is the same as the
black curve which is the inductive reactance.
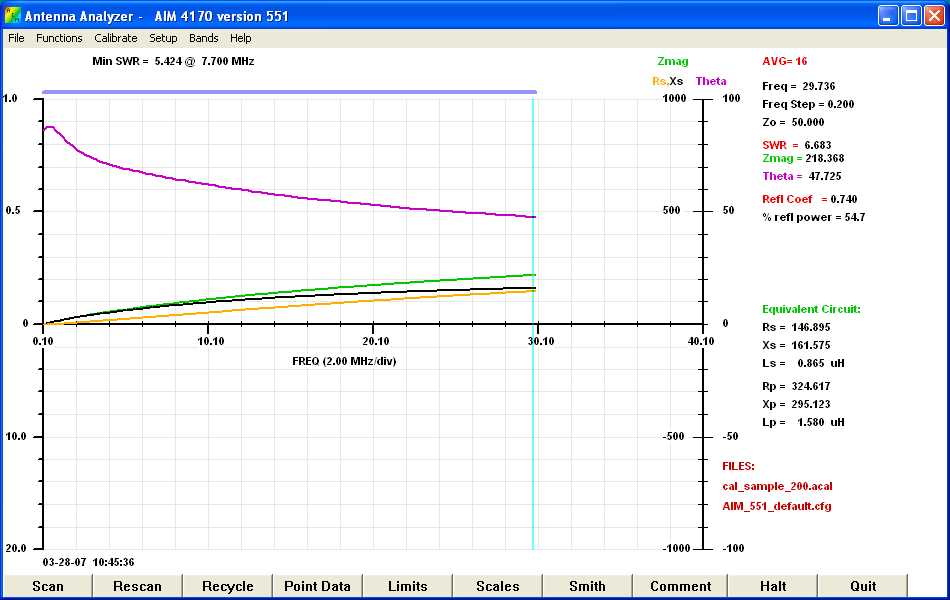
Figure 3: Single Turn of a 12 Inch Wire with a Snap-On
Ferrite of Unknown Material. (click here
for a higher resolution graph)
Now you can see that there is a resistive and an inductive reactance component to the impedance. If you look at the values on the right for a frequency of 29.736 MHz, you will see that the resistance, Rs (the s stands for series resistance), equals 147 ohms and the reactance, Xs (the s stands for series reactance), equals 162 ohms. Solving for Zmag which is equal to the square root of the sum of the squares of the resistance and reactance, we get the value 218. Since the reactance is just slightly larger than the resistance, we would expect theta to be slightly larger than 45 degrees. And indeed it is, Theta = 48 degrees.
Now what does all this mean? Well, first of all,
the
impedance now has a resistive component, which must come from the
core since there was no resistive component in Figure 2.
Also, The reactance has increased from 60.44 ohms to 161.575 ohms and Zmag
has gone from 60.444 to 218.368, a factor of more than 3.6. You can
see from this plot that we have a complex relationship here. The
inductive
reactance is no longer linear as it flattens out as frequency
increases. There is a resistive component and
theta
is no longer 90 degrees.
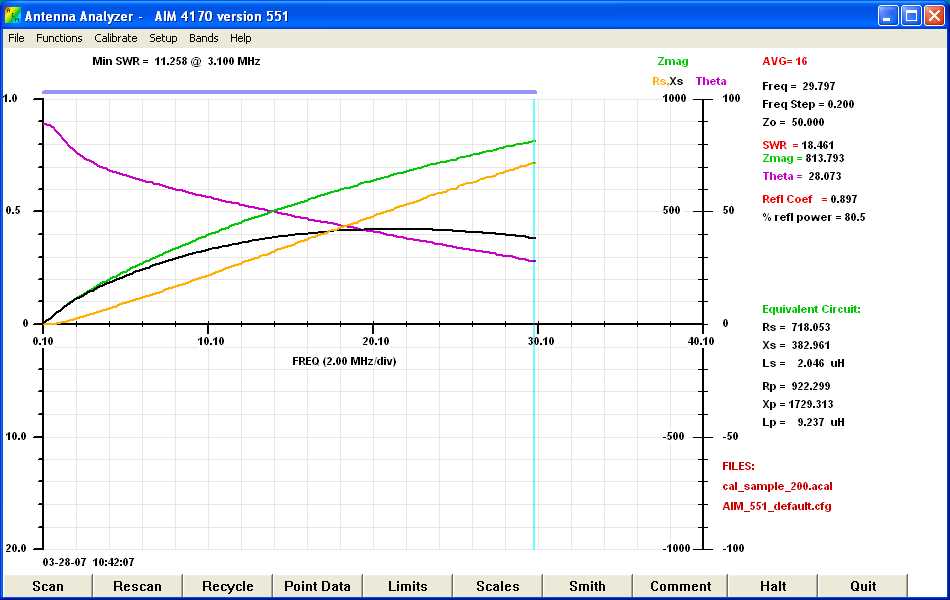
Figure 4: Two Turns of a 12 Inch Wire with a Snap-On Ferrite of Unknown Material. (click here for a higher resolution graph)
One would expect the inductance and hence the inductive
reactance to increase by a factor of four since the turns were doubled
and the increase is a function of turns increase squared. That is
not what happened. The inductive reactance is starting to fold
over as can be seen by the black curve. However, the resistance
increase was close to a factor of four. The important thing is that
Zmag,
which is responsible for the attenuation, is increasing.
If you ever wondered why some of these baluns that are wound on ferrite
were destroyed by heat, here is your answer. Remember any RF current,
at the specified frequency, through the wire would produce a power equal
to the resistance times the current squared. That power will generate
heat in the core. Let us say that we had an rms current at 30 MHz of 250
ma through our single wire (Fig 3). When
we clamp the snap-on core onto the wire, the resistance is about 147 ohms
which means that about about 9 watts will be dissipated in the core.
This core is 0.75 x 0.75 x 1.25 inches long. I would say it would
not be long for this world. That is why these ferrite snap-ons are
good for common mode currents which are generally small but should not
be used for a differential current like a decoupling choke where the RF
current could be large unless the resistive part is small enough not to
cause a power heating problem.
One interesting feature in Figure 4 is the
inductive reactance starting to turn over. Out of curiosity,
I extended the sweep range to 170 MHz to see where that was going. Figure
5 shows the results of that frequency sweep extension.
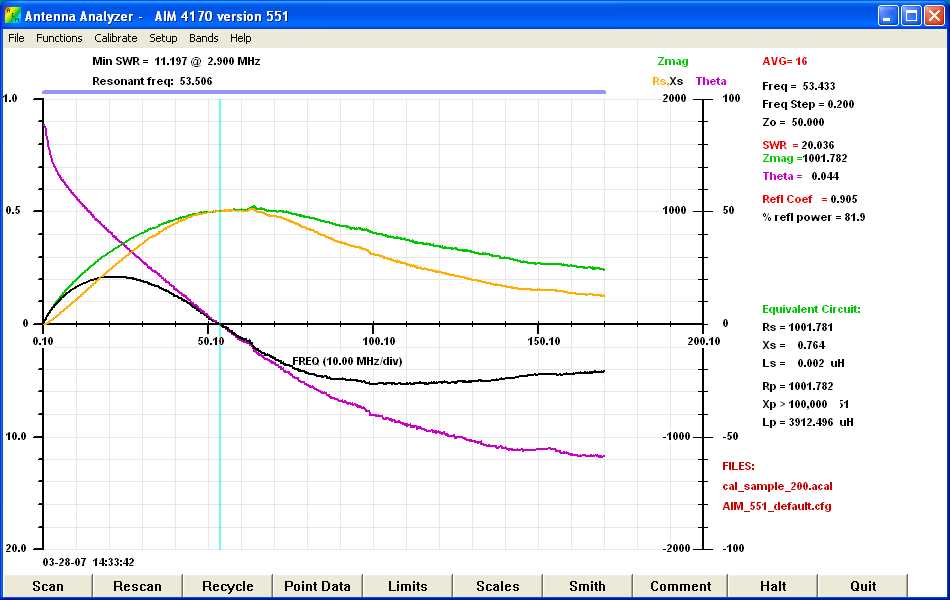
Figure 5: Extended Frequency Scan Two Turns of a 12 Inch Wire With a Snap-On Ferrite of Unknown Material. (click here for a higher resolution graph)
As one can see from Figure 5, theta goes through zero and becomes negative at 53.506 MHz. The reactance part of the impedance becomes capacitive at this point and Zmag turns over and starts becoming less. The resistance component is decreasing, and the capacitive reactance is increasing. However, the resistance continues to decrease after the capacitive reactance levels off. Since Zmag is a function of both these quantities, it decreases. Now, one might speculate that the capacitance between those two turns of wire is what caused this resonance condition. The maximum reactance over the whole frequency range occurs at 20 MHz and is about 400 ohms, which translates to an inductance of about 3.2 uH. The capacitance needed to resonate that inductance at 53 MHz, is about 2.8 pF. If I place two wires adjacent to each other as they might be placed as they pass through the snap-on core, the capacitance between the two wires is about 2.5 pF. So, I have concluded that it is the inter-winding capacitance of the two wires that cause the inductance to turn over, decrease, and finally become zero at the resonant point.
So what does all this mean. Traditionally one thinks of a core material as a concentrator of magnetic field lines. In other words, the core brings the field lines closer together which raises the inductance. The amount that this is done is reflected in the permeability of the core. Air has a permeability of one. A type 43 material ferrite has an initial permeability of 850. The interesting thing about ferrite permeability is that it is not a constant, but instead a complex quantity consisting of resistance and reactance. I am certainly no expert on magnetics, so for a good discussion on this subject, click HERE.
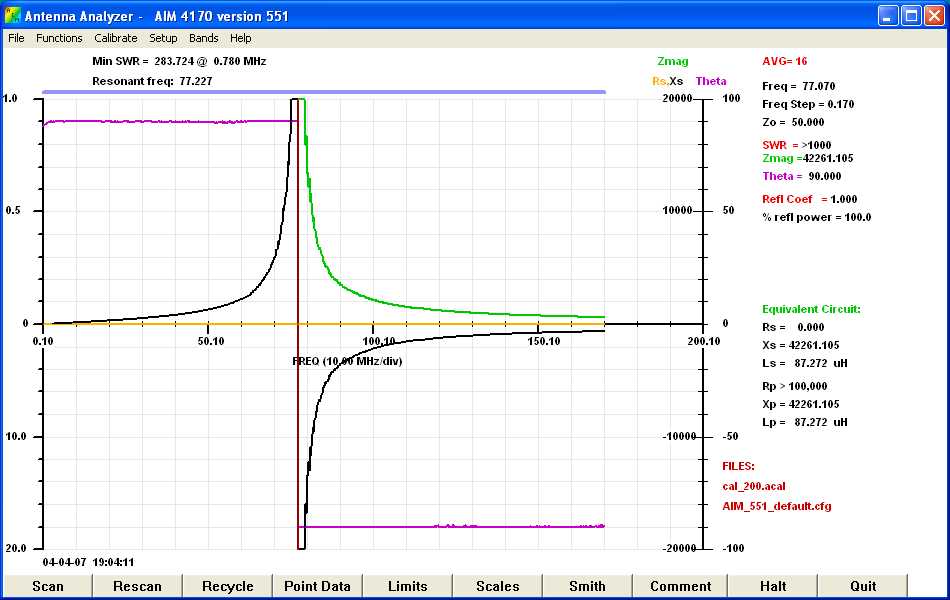
Figure 6: Nineteen Turns on a T-80-2 Powdered Iron Core. (click here for a higher resolution graph)
As you can see from Figure 6, the resistance remains zero and the self-resonace is very sharp. Theta switches from +90 degrees on the low frequency side of resonance to -90 degrees on the high frequency side of resonance just as you would expect for an air inductor. This behavior for the powdered iron core is very different from the ferrite cores shown above.
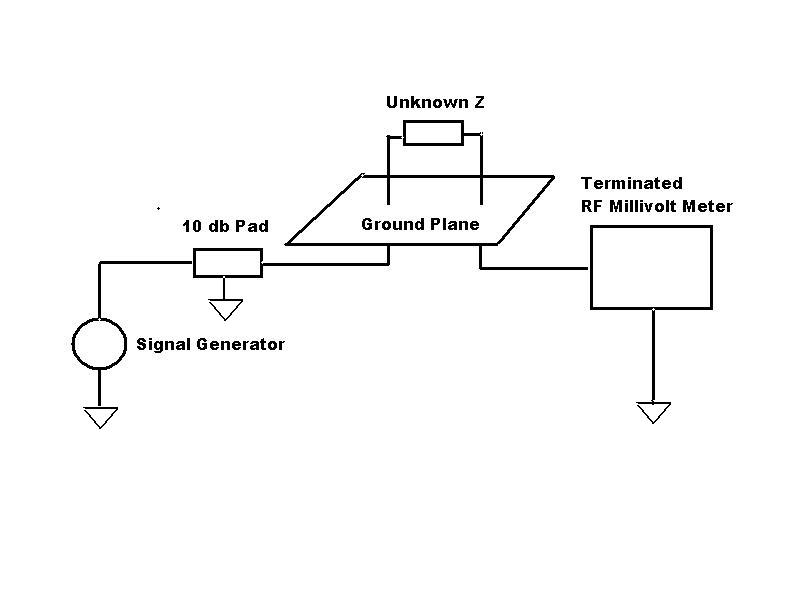
Figure 7: Test Jig for Measuring Attenuation of Cores
In order to determine the actual attenuating capability
of a ferrite core, I wound several FT-114-43 and FT-114-77 cores and placed
them in the jig shown in Figure 7. In order to
determine a reference level, I substituted a short for Z unknown and recorded
the reading. When Z unknown is of some value that causes an attenuation
of > 20 db, then the output of the 10 db pad is essentially open so the
output rises by 6 db. To compensate for this, 6 db of attenuation
should be added to every reading. When one does this, one can calculate
the expected attenuation by using the measured Zmag from the AIM
4170. The expected attenuation factor in db is given by :
Attenuation = 20* Log((Zmag + 50)/50).
This will yield a result within a few db of the measured values.
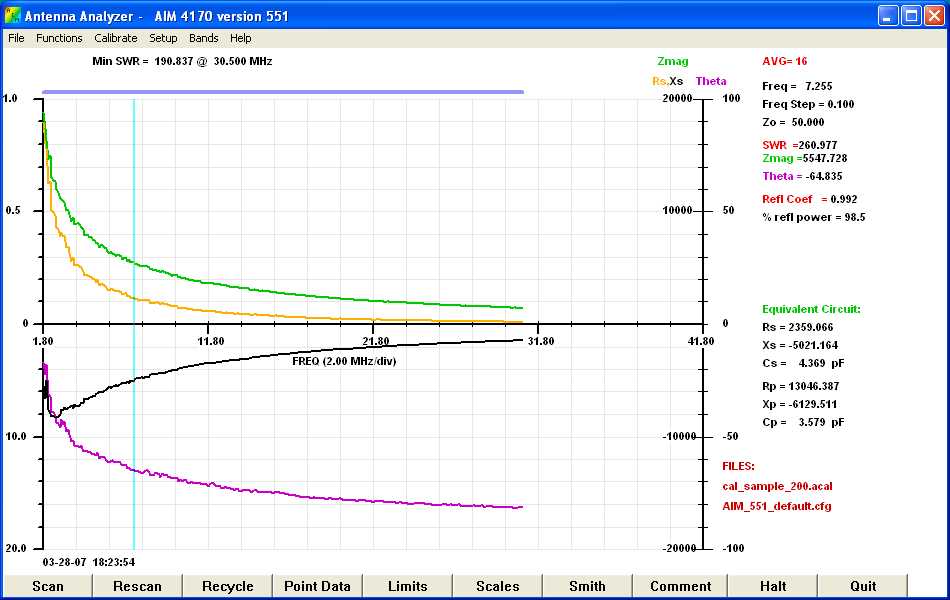
Figure 8: 30 Turns on an FT-114-77 Core. (click
here
for a higher resolution graph)
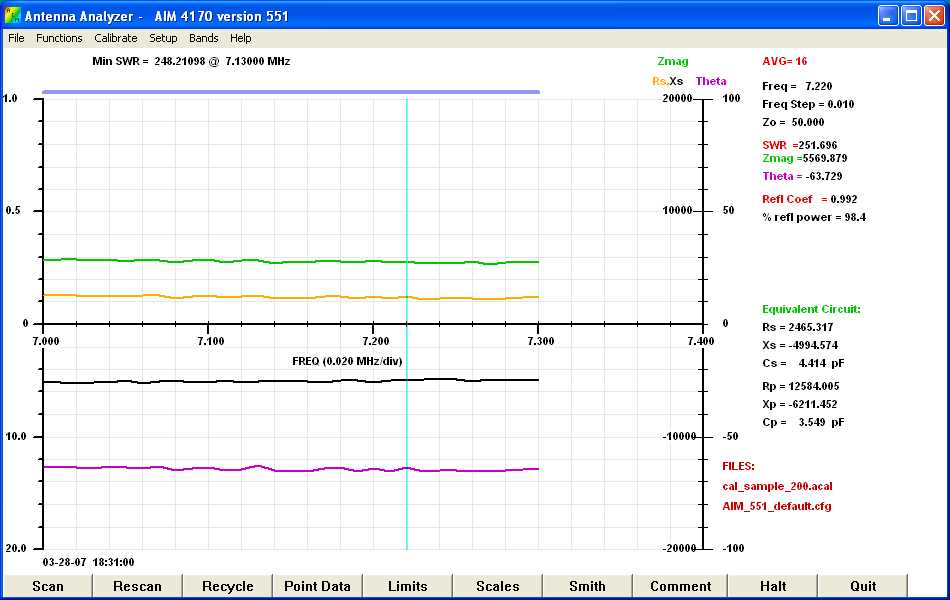
Figure 9: 30 Turns on an FT-114-77 Core Expanded View for 40 Meters. (click here for a higher resolution graph)
When you first look at Figure 8, it looks
terrible. But let's take a closer look. First of all, the reactive
part of the impedance is capacitive from the start, but the
capacitance is small so the reactance is still pretty large for the 40
meter band where I am using this core. Also, the resistance appears
in series with this reactance. In fact, Figure 9 shows
that the impedance is almost flat over the 40 meter band with a Zmag =
5570 ohms at 7220 kHz. The attenuation in our jig shown in Figure
7 should be 20*Log((5570+50)/50) = 41 db. When I placed it
in the jig, I measured 43 db. I would have done a similar plot for
an FT-114-43 core, but the only one I had on hand is in a halogen light
in a neighboring building. Nevertheless, the plot would have been
similar with a little more attenuation at the higher frequencies.
The curves shown in Figure 10 are the results of attenuation measurements of both FT-114-43 and FT-114-77 cores on all the HF ham bands.
Figure 10: Attenuation of FT-114-77 and FT-114-43 Cores vs Frequency. (click here for a higher resolution graph)
As you can see from Figure 10, more turns
do not always mean more attenuation as seen in the blue and tan curves.
The literature has always recommended a type 77 material ferrite for the
lower HF bands and a type 43 ferrite for the upper HF bands, and the red
and black curves confirm that. And, not surprisingly, a 43 core in
series with a 77 core yields good attenuation across the whole HF band
as seen by the green curve. Figure 10 gives a quantitative
result for what we have known qualitatively for years.
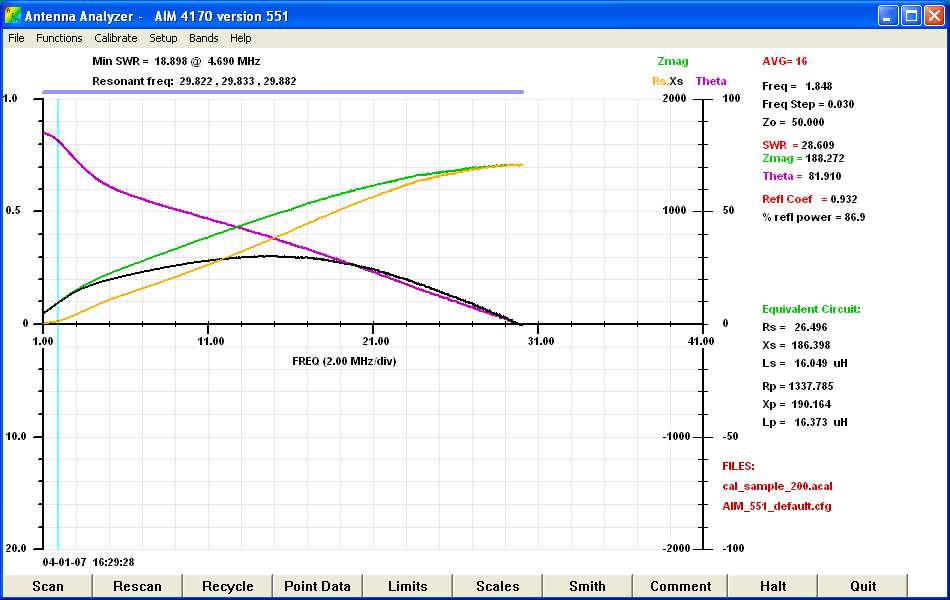
Figure 11: Attenuation of Seven SB-1020-43 Ferrite Beads. (click here for a higher resolution graph)
As you can see from the plot in Figure 11, the attenuation on 160 meters is mainly due to the inductive reactance part of the impedance, whereas the attenuation at 10 meters is mainly due to the resistive part of the impedance. If we assume the minimum impedance is 4 X 50 = 200 ohms, seven beads is just adequate for the 160 meter band. From our experience from previous measurements, if we slipped a few more beads on the coax, we would see that the reactive part of the impedance would be capacitive at the 10 meters frequency, but Zmag would still be large and give plenty of attenuation.
I hope that this analysis has been interesting and has explained some of the strange results you may have gotten when using ferrites in the past. Ferrites are wonderful materials that I feel we as hams will be using more and more. With antennas being forced down lower, the chances of interference to less and less robust consumer electronics are increasing. A common mode choke using either ferrite snap-ons or ferrite cores can eliminate a lot of this interference. Also, many new lighting plans include halogen lights with switching power supplies that generate interference at high frequencies. Common mode chokes may be useful in these situations, also. Many consumer devices such as plasma TVs will radiate into our HF bands. Common mode chokes on leads emanating from these devices may very well cure the problem.Conclusions
I learned from these measurements that the ferrite material itself can be responsible for an inductor having a high resistive component . The permeability of the material , which is a function of frequency, account for the interesting behavior the inductance over the frequency range. Also, there is resistive component that varies with frequency.
The maximum attenuation of a wire passing through or wound on a ferrite core does not necessarily occur at the frequency where the inductive reactance is maximum, but instead where the magnitude of the impedance is maximum. Useful attenuation may even occur at a frequency that is higher than the self resonant frequency where the reactance is capacitive.
The type of material one uses for a common mode choke whether it be 33, 43, 61, or 77 material is a function of the band of frequencies that need to be attenuated. A core material should be chosen such that the frequencies to be attenuated are near the frequency where theta crosses zero. However, good attenuation may be had at frequencies removed from this resonant point because of the low Q of the coil.
One must consider resistivity and permeability when slipping ferrite beads over a conductor to gain some common mode attenuation, because the attenuation and loss is effected by all of these parameters.
Also, a good understanding of the loss factor of a ferrite might save you from a very hot core.
Remember that there is big difference between a ferrite core and a powdered iron core. A coil wound on a powdered iron core behaves much like an air core as long as the core does not saturate, but a coil on a ferrite core may be very lossy. Also, since permeability is temperature dependent a ferrite core should not be used in a resonant circuit.
If nothing else this strange phenomenon of a coil of wire
looking resistive and even capacitive has been interesting to me.
I hope you have found it interesting, too!