 A.....
 B.....
 C.....
 D.....
 E.....
 F.....
 G.....
 H.....
 I.....
 J
J
A Most Excellent Adventure
in
Kiruna, Sweden
January-March 2000
(click on pictures to enlarge)
Data Analysis and Theory
Having an instrument perform on a research aircraft is only a small step in the process. The data collected have to be analyzed and interpreted. Each experimental group generally does its own data analysis and some of its own interpretation. Running an instrument and analyzing data on one of these missions is more than a full time job. So, some theorists actually come into the field to help with mission planning and data interpretation. Most of these theory teams run models in order to predict the future of the chemistry of the atmosphere. However, in order for the model to predict accurately, it has to be consistent with the data that is being gathered. It is a never ending process between measurement and theory to fine tune a model so that it will give an accurate prediction.
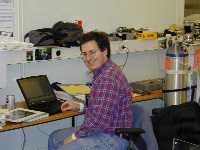
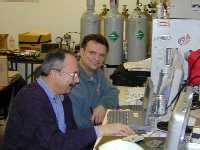
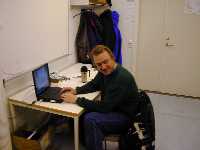
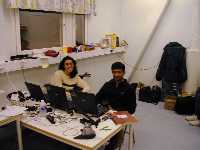
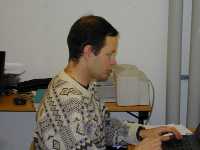
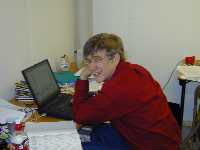
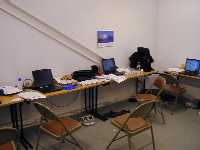
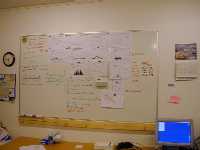
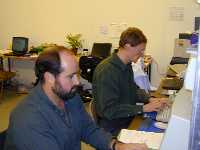
We are connected to a huge LAN (local area network) with over 200 nodes. That network is in turn connected to the WAN (wide area network) via a high speed line to Stockholm where it eventually reaches you. This not only allows data products to be moved back and forth between Kiruna and the various home bases, but allows the people here to keep in contact via email. This sequence pictures some of the experimenters working on their data after a flight or doing email. Picture A shows Bob with the JPL water instrument . B shows Bob and David with the Canadian CPFM instrument. Picture D is of Dave with Georgia Tech, while E shows Karena and Suresh from Cal Tech all of whom are associated with the CIMS instrument. Pictures E and F are of Chuck and Chuck, both with Denver University, who run the FCAS/NMASS instrument. Picture G shows the NOy side of the NOy/ACATS office space. Picture H is the bulletin board with some of the data and reminders for the NOy/ACATS team. Picture I shows Dale and Pavel from ACATS reducing data while J shows some of Pavel's IDL code and graph.
 A.....
 B.....
 C.....
 D.....
 E.....
 F.....
 G.....
 H.....
 I.....
 J
J
One of the most important aspects of a mission like this, is the mission planning. This planning includes what is interesting scientifically as well as the local and enroute weather for the airplane. The ER-2 is a very specialized aircraft with long, glider-type wings, and a skate-board type landing gear. The runway braking conditions and crosswind conditions are very important for the safety of the flight. Whereas, these conditions can be determined in real time at take off, the landing conditions have to be forecast. There is sparse satellite and ground observational data available for this remote location, so Greg, the forecaster, has to rely on several model predictions as well as a few polar orbiting satellite images. Even with modern technology, the remoteness of Kiruna requires that Greg fine tune things as he goes along with regards to the influence of the Norwegian mountains to our west.
One of the aspects of operating in this polar region during the winter is to be close to the polar vortex which is a large circulation pattern of stratospheric air that circulates the polar region. The ER-2 typically does an eight hour flight. At 400 knots the ER-2 can only get 1600 nm away from base, so it has to based relatively near the phenomenon of interest. Therefore, when doing experiments that involve the polar vortex, details of that vortex on a day to day basis is important. Satellite images along with models that track air parcels are used to determine where the next flight track should be. Picture A shows Leslie and Randy from NASA Goddard studying a computer output. Lenny from NASA Ames is shown in picture B. Greg, formerly from Penn State and currently with the Weather Channel, is shown in picture C while Andreas, from the FALCON team is shown picture D.
Several theory groups are involved with SOLVE. These groups run models and interpret data with respect to these models to help the understanding of the data that is gathered. Shown in picture A is Ross from JPL. Picture B shows Ross from JPL, Stewart from Leeds, Duncan , and Brad both from NASA Langley. Katja (in the background from NASA Ames) and Markus from the AWI/JPL are shown in picture C, while Katja from NASA Ames is shown in picture D.
Another room of theorists are shown in the next sequence. Bill, from APL, is shown in picture A and Michael, from AER, is shown in picture B. Picture C shows Cora from LASP and Karl from NRL , whereas picture D shows Michael (AER), Cora (LASP), and Karl (NRL). Picture E is of Ken from the University of Leeds. Picture F is of Will from MIT. Gebhard from Jülich is shown in picture G while Simon and Ronming both from the University of Leeds are shown in picture H. Finally a typical plot from Cora is shown in picture I.